Researchers from many fields including archaeology, ecology, geography, and earth systems modelling regularly express their interest in reconstructions of past vegetation. However, they often face difficulties accessing such information or are overwhelmed by the sheer amount of data, the format in which data is published (i.e., raw pollen counts) and the methodology involved. Expecting non-experts to through every publication for in-depth information and then compile, harmonize, and analyze datasets from different sources is an unreasonable endeavor. Hence, experts from the field should put in extra effort to make their work available and reduce the effort required for non-experts to obtain the desired piece of information.
To overcome such interdisciplinary barriers, we here provide pollen-based vegetation reconstructions from Europe during the Last Glacial period using the “Regional Estimates of VEgetation Abundance from Large Sites” (REVEALS) model1. REVEALS uses fossil pollen data, plant-specific parameters such as the relative pollen productivity, and site information to quantitatively model the vegetation composition of the past. Previous studies have shown that fossil pollen data do not reflect the past vegetation 1-to-1 and that the output produced by REVEALS is much closer to the actual paleovegetation. However, despite providing more accurate vegetation reconstructions, researchers often remain overwhelmed by the output REVEALS generates. For every plant species, at every site and every timestep, a land-cover percentage is assigned, which ends up producing large files of data that are difficult to survey and interpret.
One way to tackle this data jungle is through visualization using paleovegetation maps. For this reason, we designed the browser-based application PALVEG2, which dynamically generates maps from REVEALS data and requires no prior coding experience from its users. In PALVEG, users can define the time frame between 75–15 thousand years before present in 1000-year increments and the plant species or group of plant species they are interested and PALVEG will generate a simple yet powerful map that contains the most relevant information. Moreover, PALVEG not only provides maps based on REVEALS land-cover reconstructions, but also based on fossil pollen data and a comparison between both reconstruction techniques. Lastly, PALVEG allows users to choose between using raw data and aggregated data (combining data into 1000-year time bins) and offers different display options to facilitate readability of the results. All PALVEG features are easily implemented using a slider to specify the time interval and dropdown menus to select plant species, and options to choose the model, type of data and scale options. With the PALVEG application, we bring vegetation reconstructions from the past in an easily accessible format to researchers from various other fields.
1Sugita, S.: Theory of quantitative reconstruction of vegetation I: pollen from large sites REVEALS regional vegetation composition, The Holocene, 17, 229–241, https://doi.org/10.1177/0959683607075837, 2007.
2https://oakern.shinyapps.io/PALVEG/
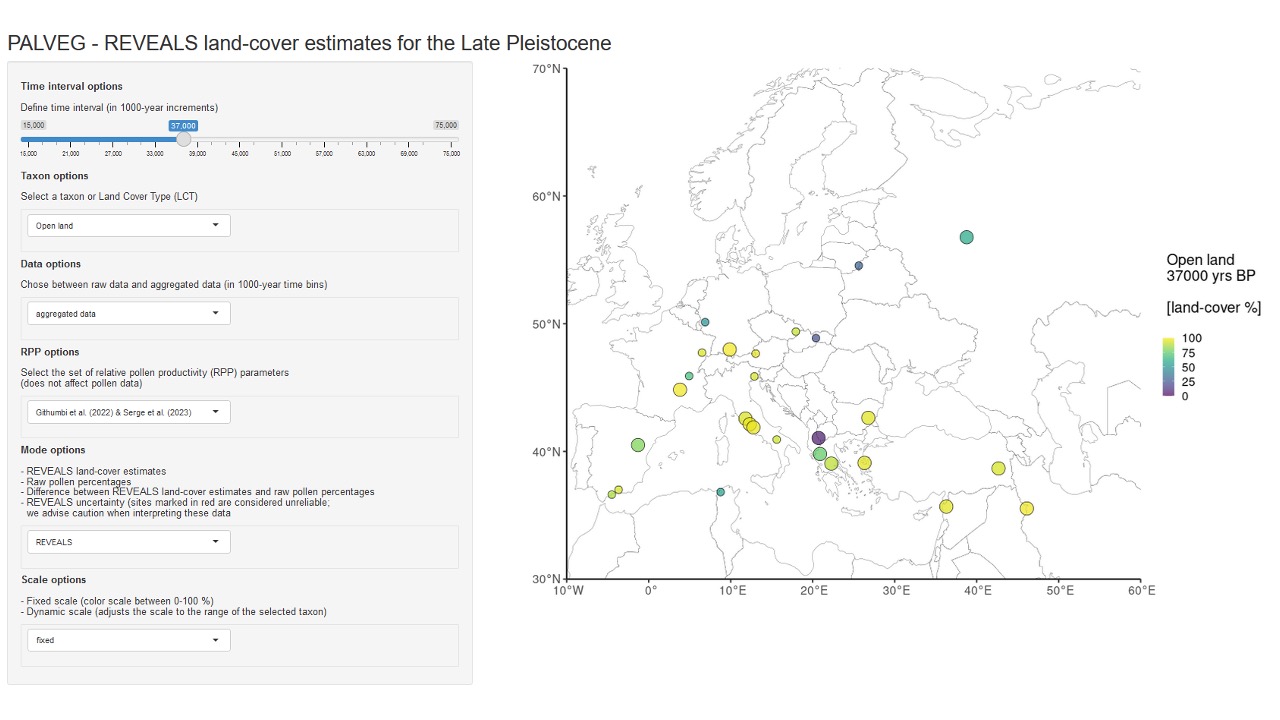
Fig. 1: User interface of the PALVEG app. In the panel on the left hand side, various options such as the desired time interval, specific (groups of) taxa, and different display options can be selected. On the right hand side, maps are dynamically generated based on the user input.